Dashboards
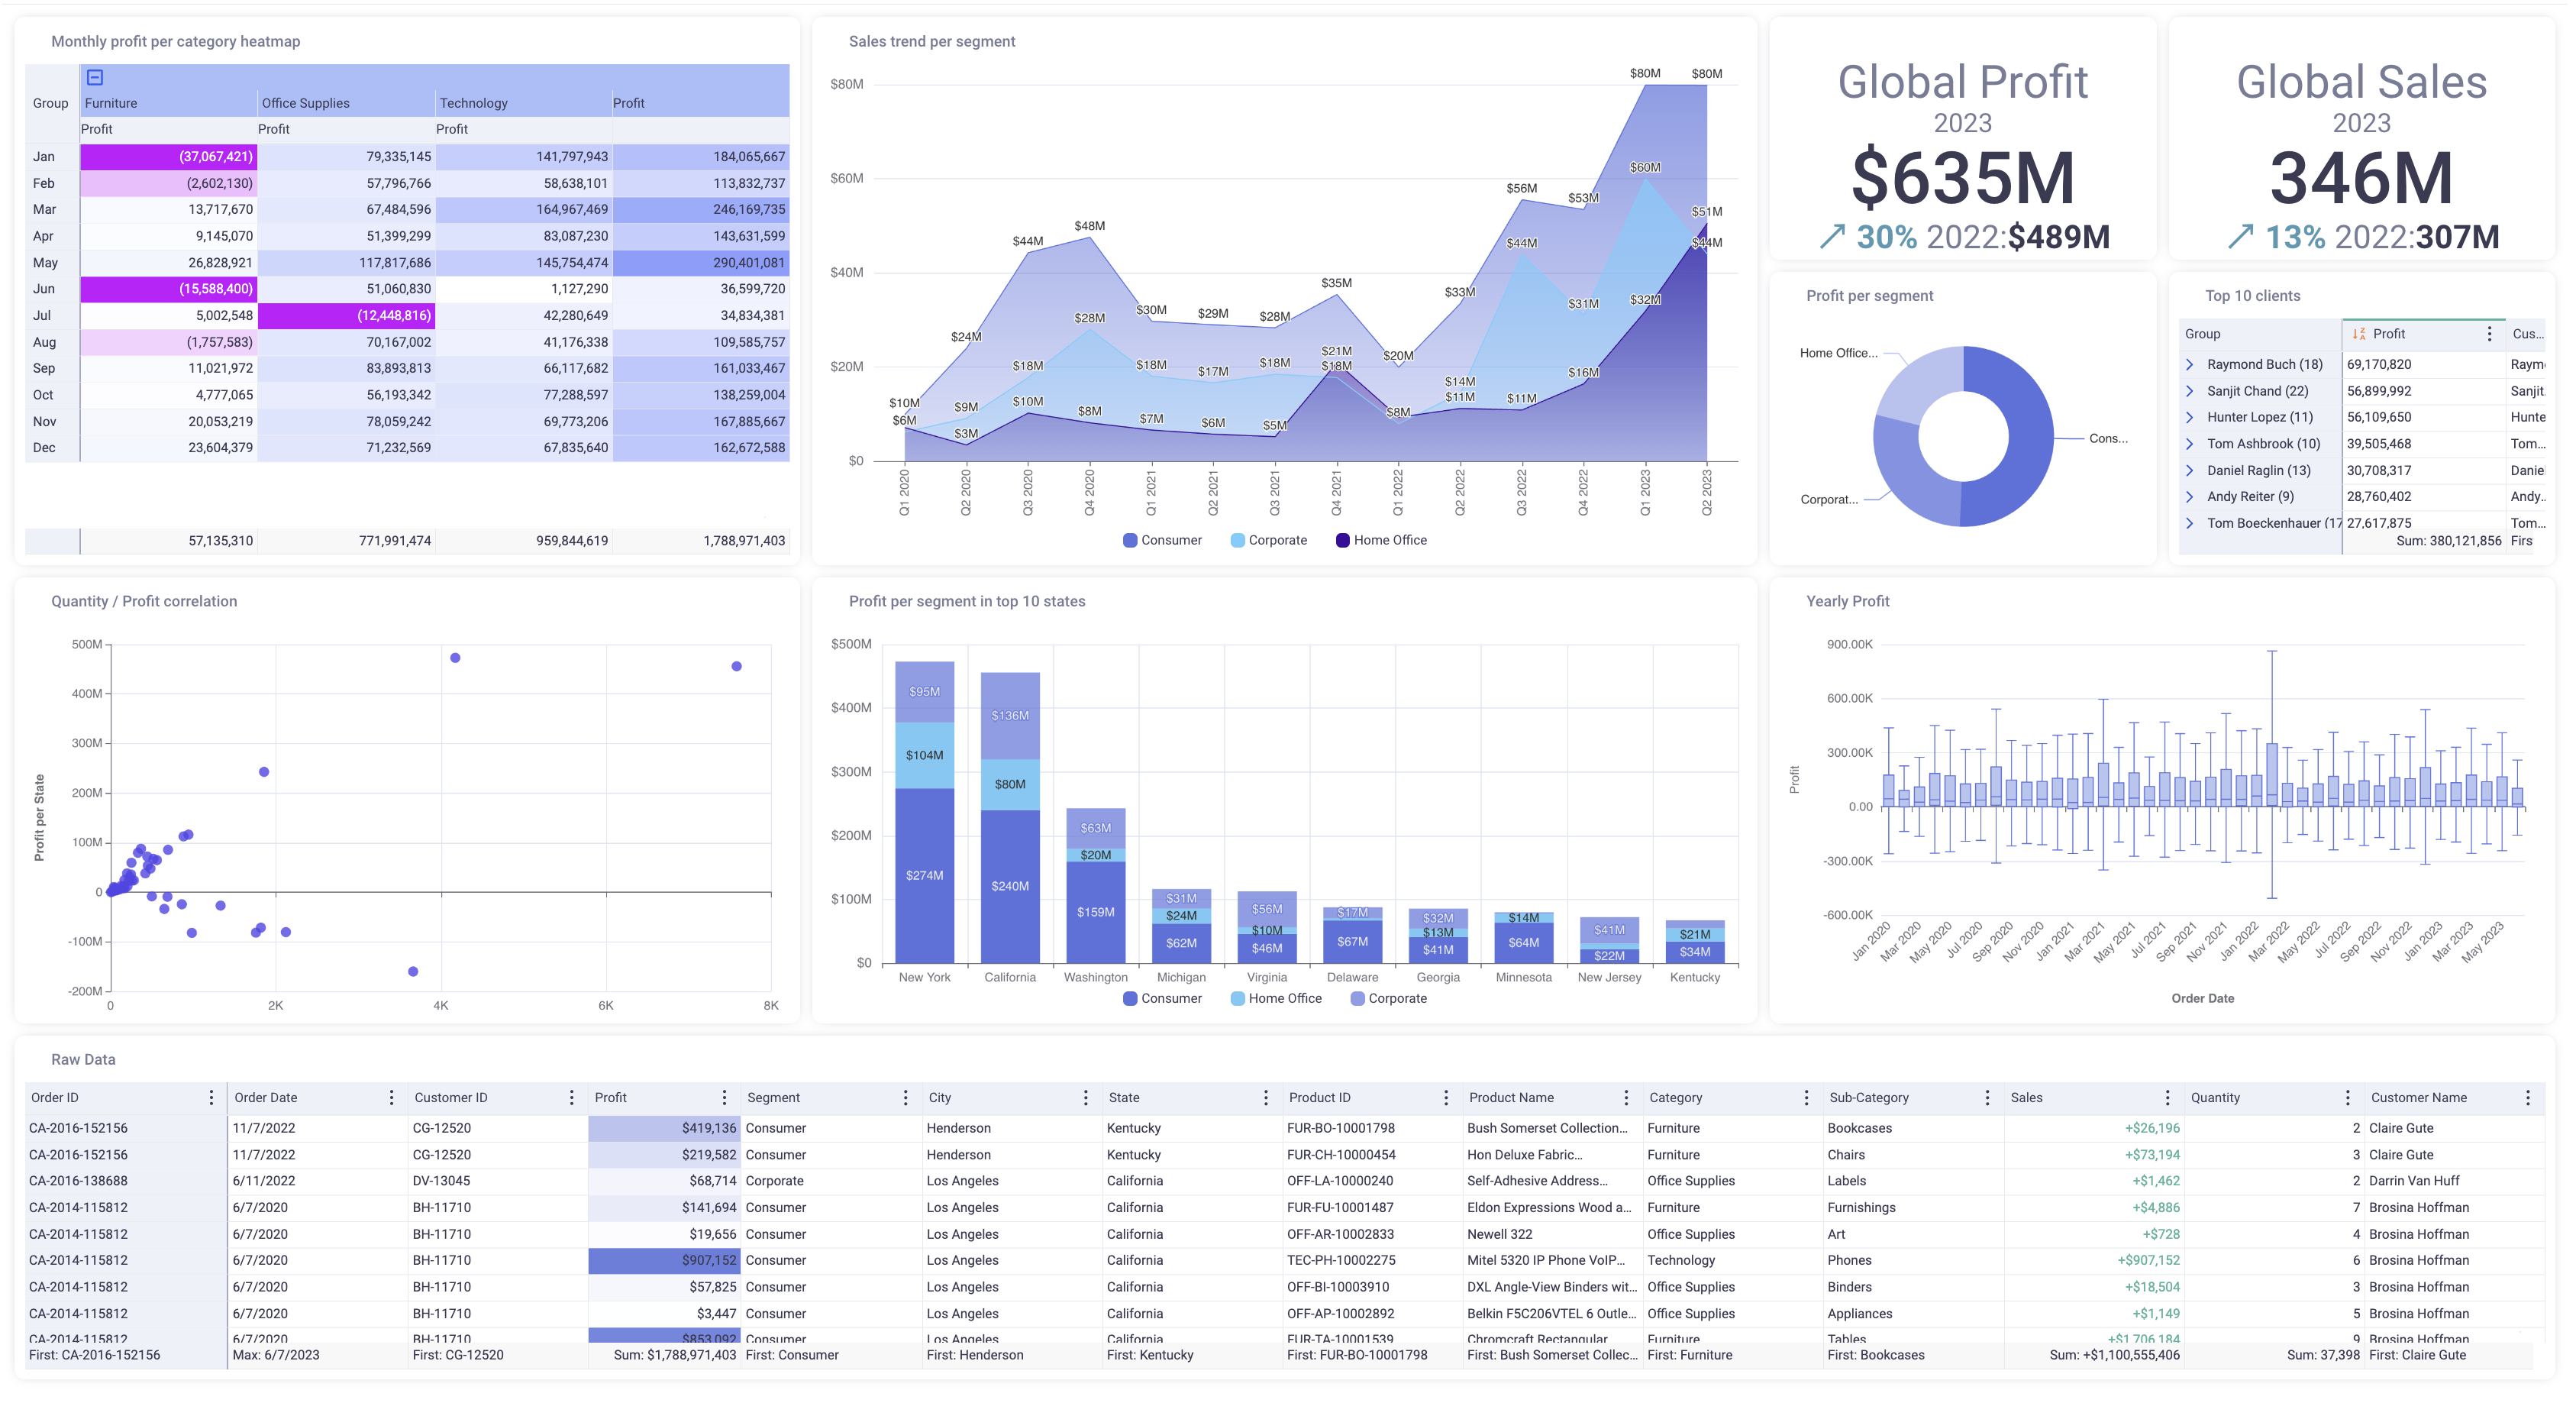
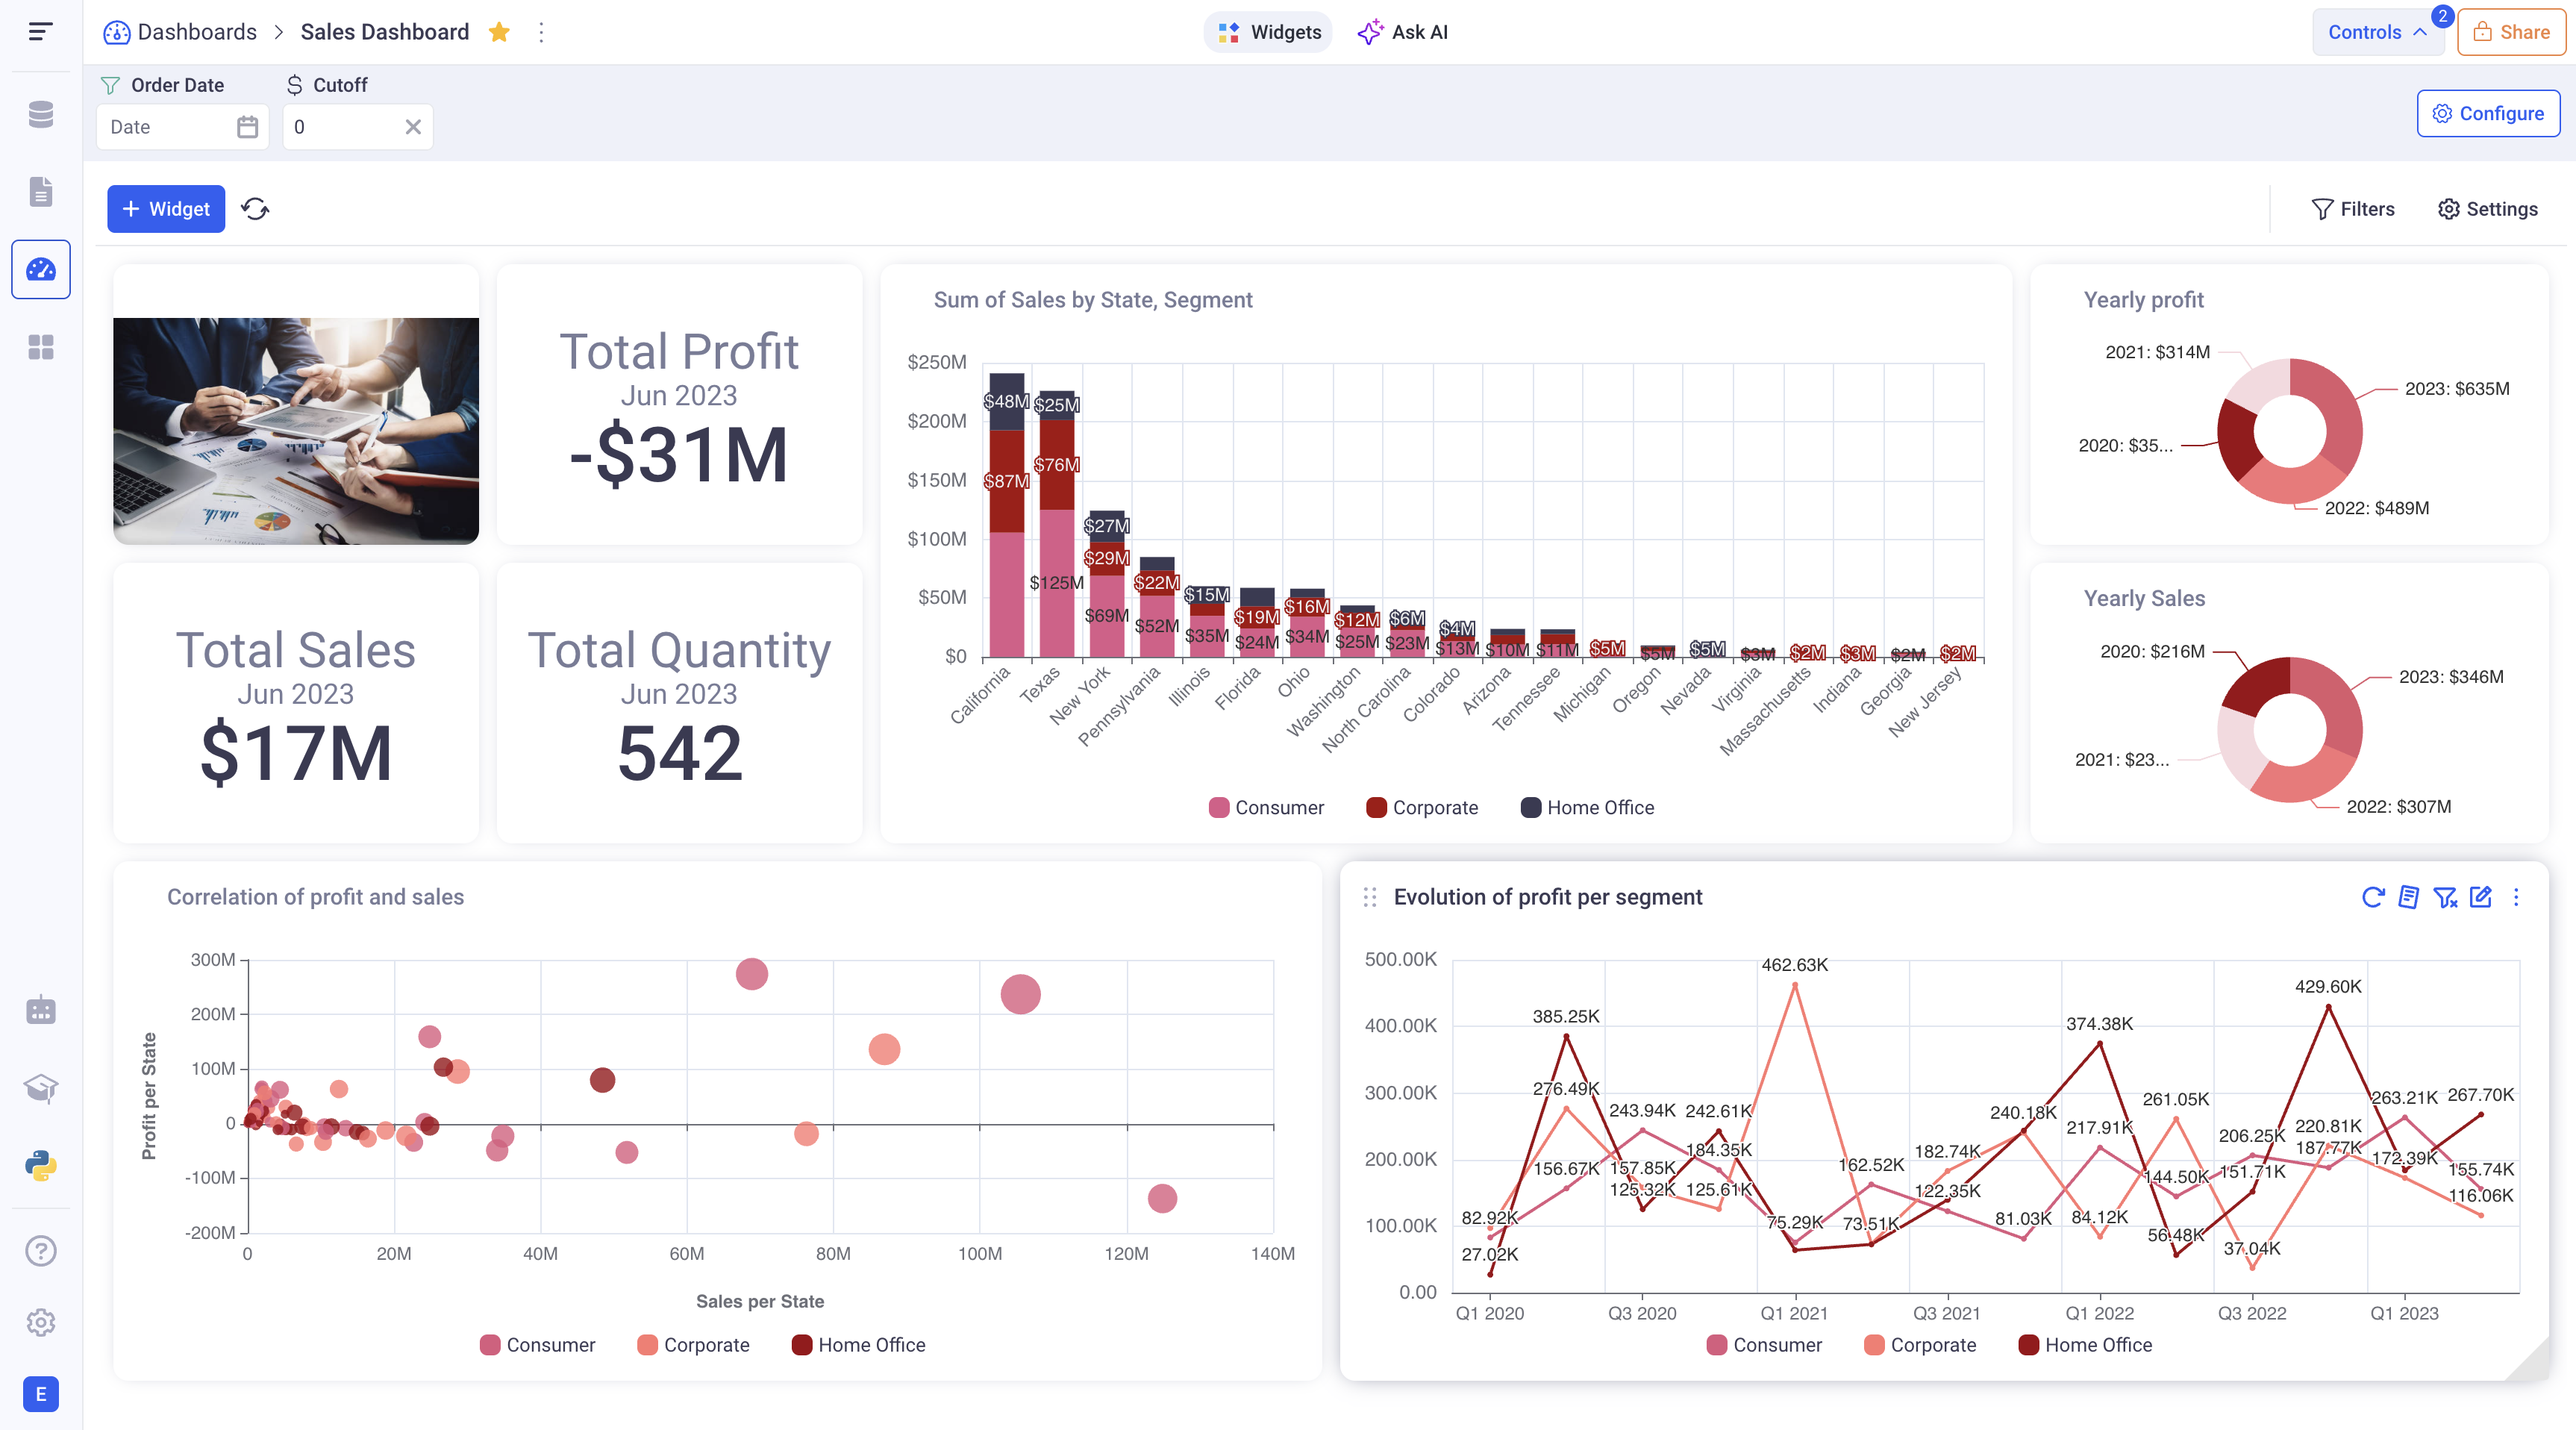
Dashboards in KAWA serve as dynamic, interactive interfaces that consolidate and visualize data from various sources, enabling users to monitor key metrics and derive actionable insights in real-time. By integrating charts, grids, and pivot tables, KAWA dashboards facilitate a comprehensive view of business operations, allowing for efficient data analysis and decision-making. These dashboards are designed to be customizable, catering to diverse user needs and preferences.
1 Creating dashboards and adding new widgets
1.1 Creating new dashboards
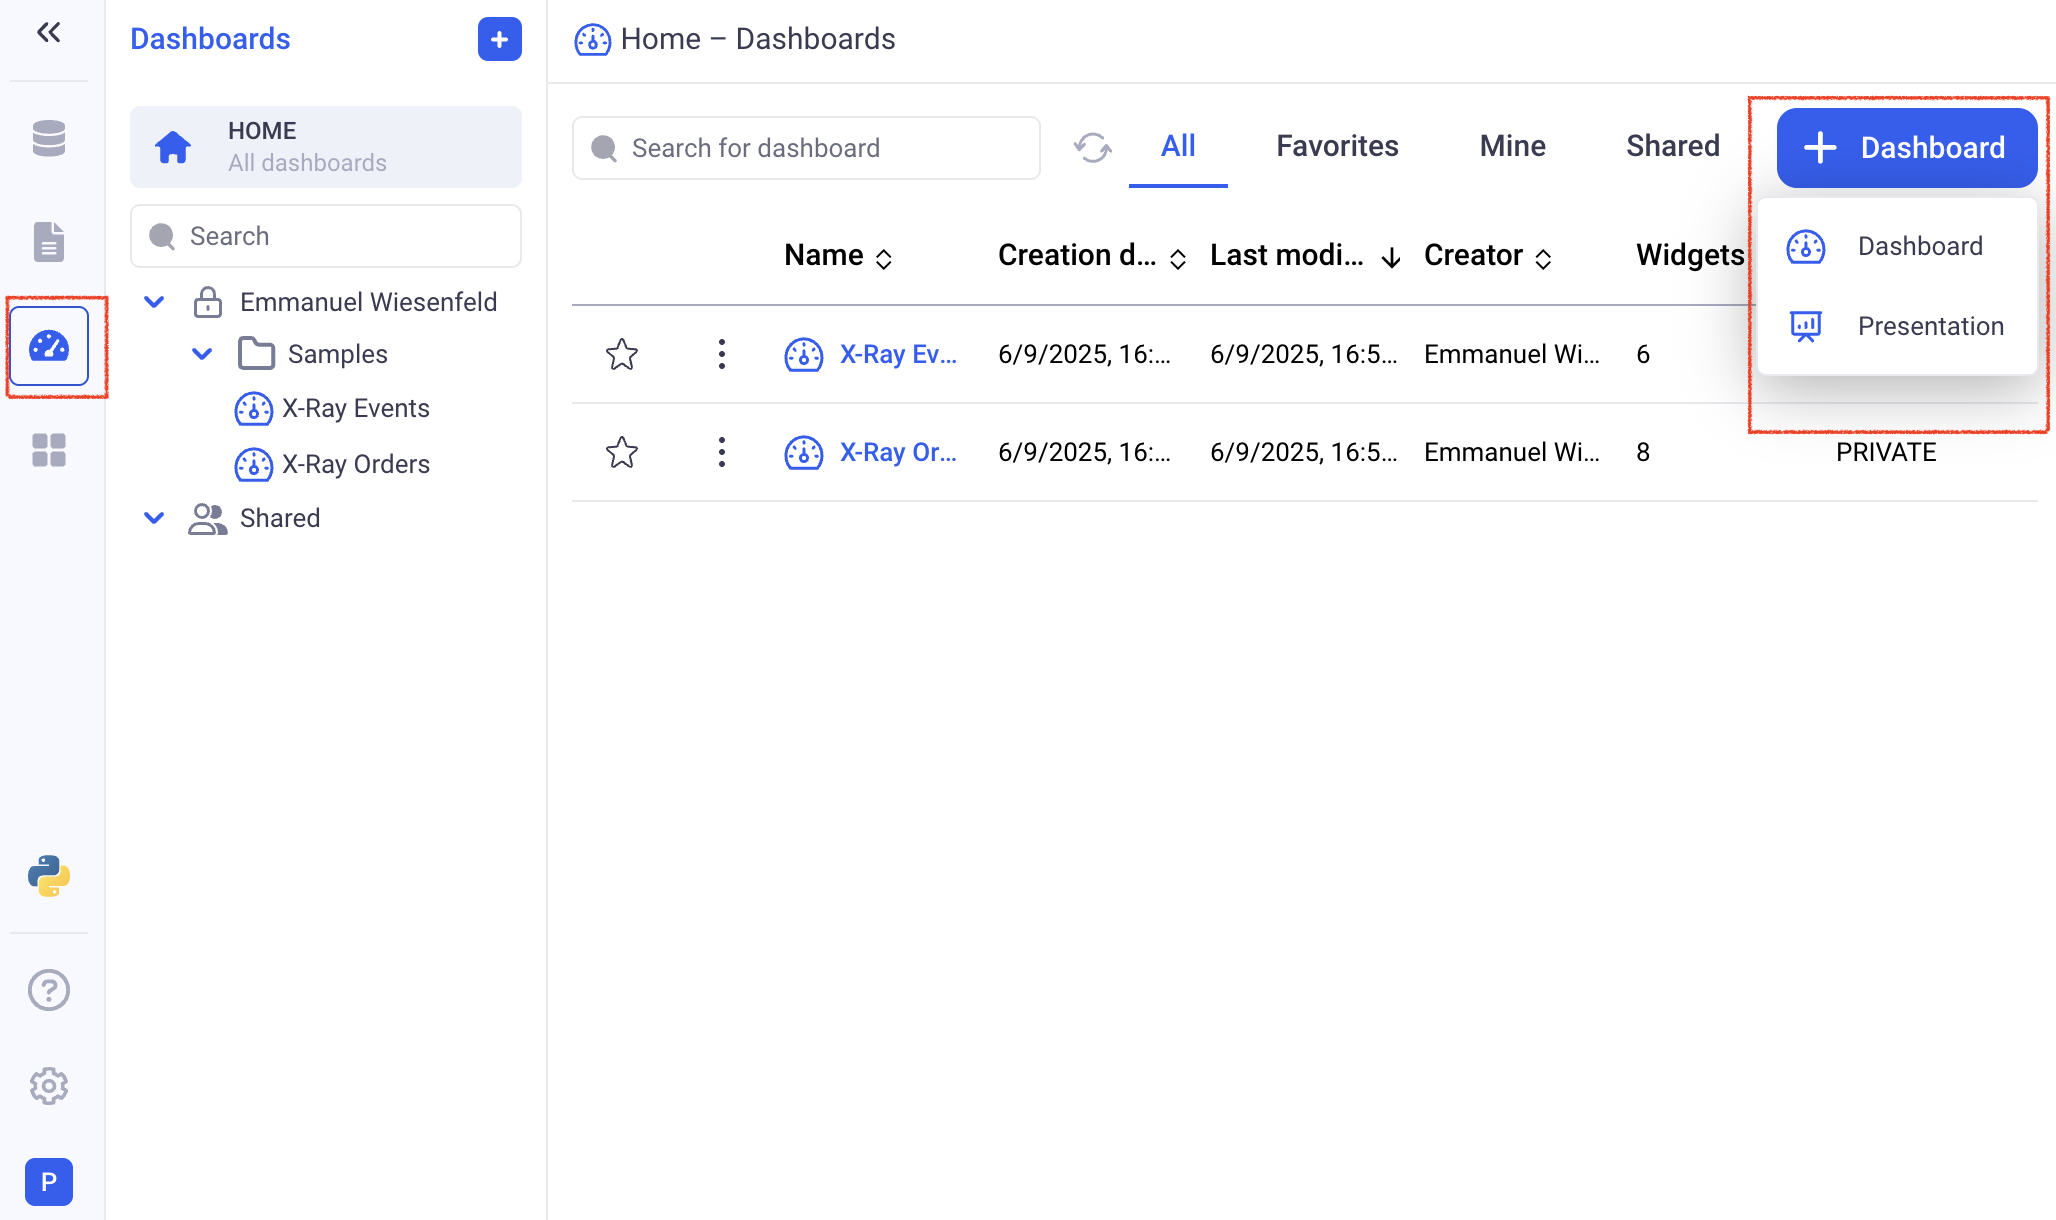
In order to create a dashboard, go to the dashboard section and click on (+ Dashboard). You can then pick one of the two available layouts:
- Dashboard: It is a blank canvas with unlimited height
- Presentation: It is similar to power point and lets you create slides of fixed size.
1.2 Adding widgets to dashboards
When clicking on the (Add Widget) button, the widget selector will be displayed. It lets you choose views from sheets, widgets from existing dashboards or static blocks to add to your dashboard.
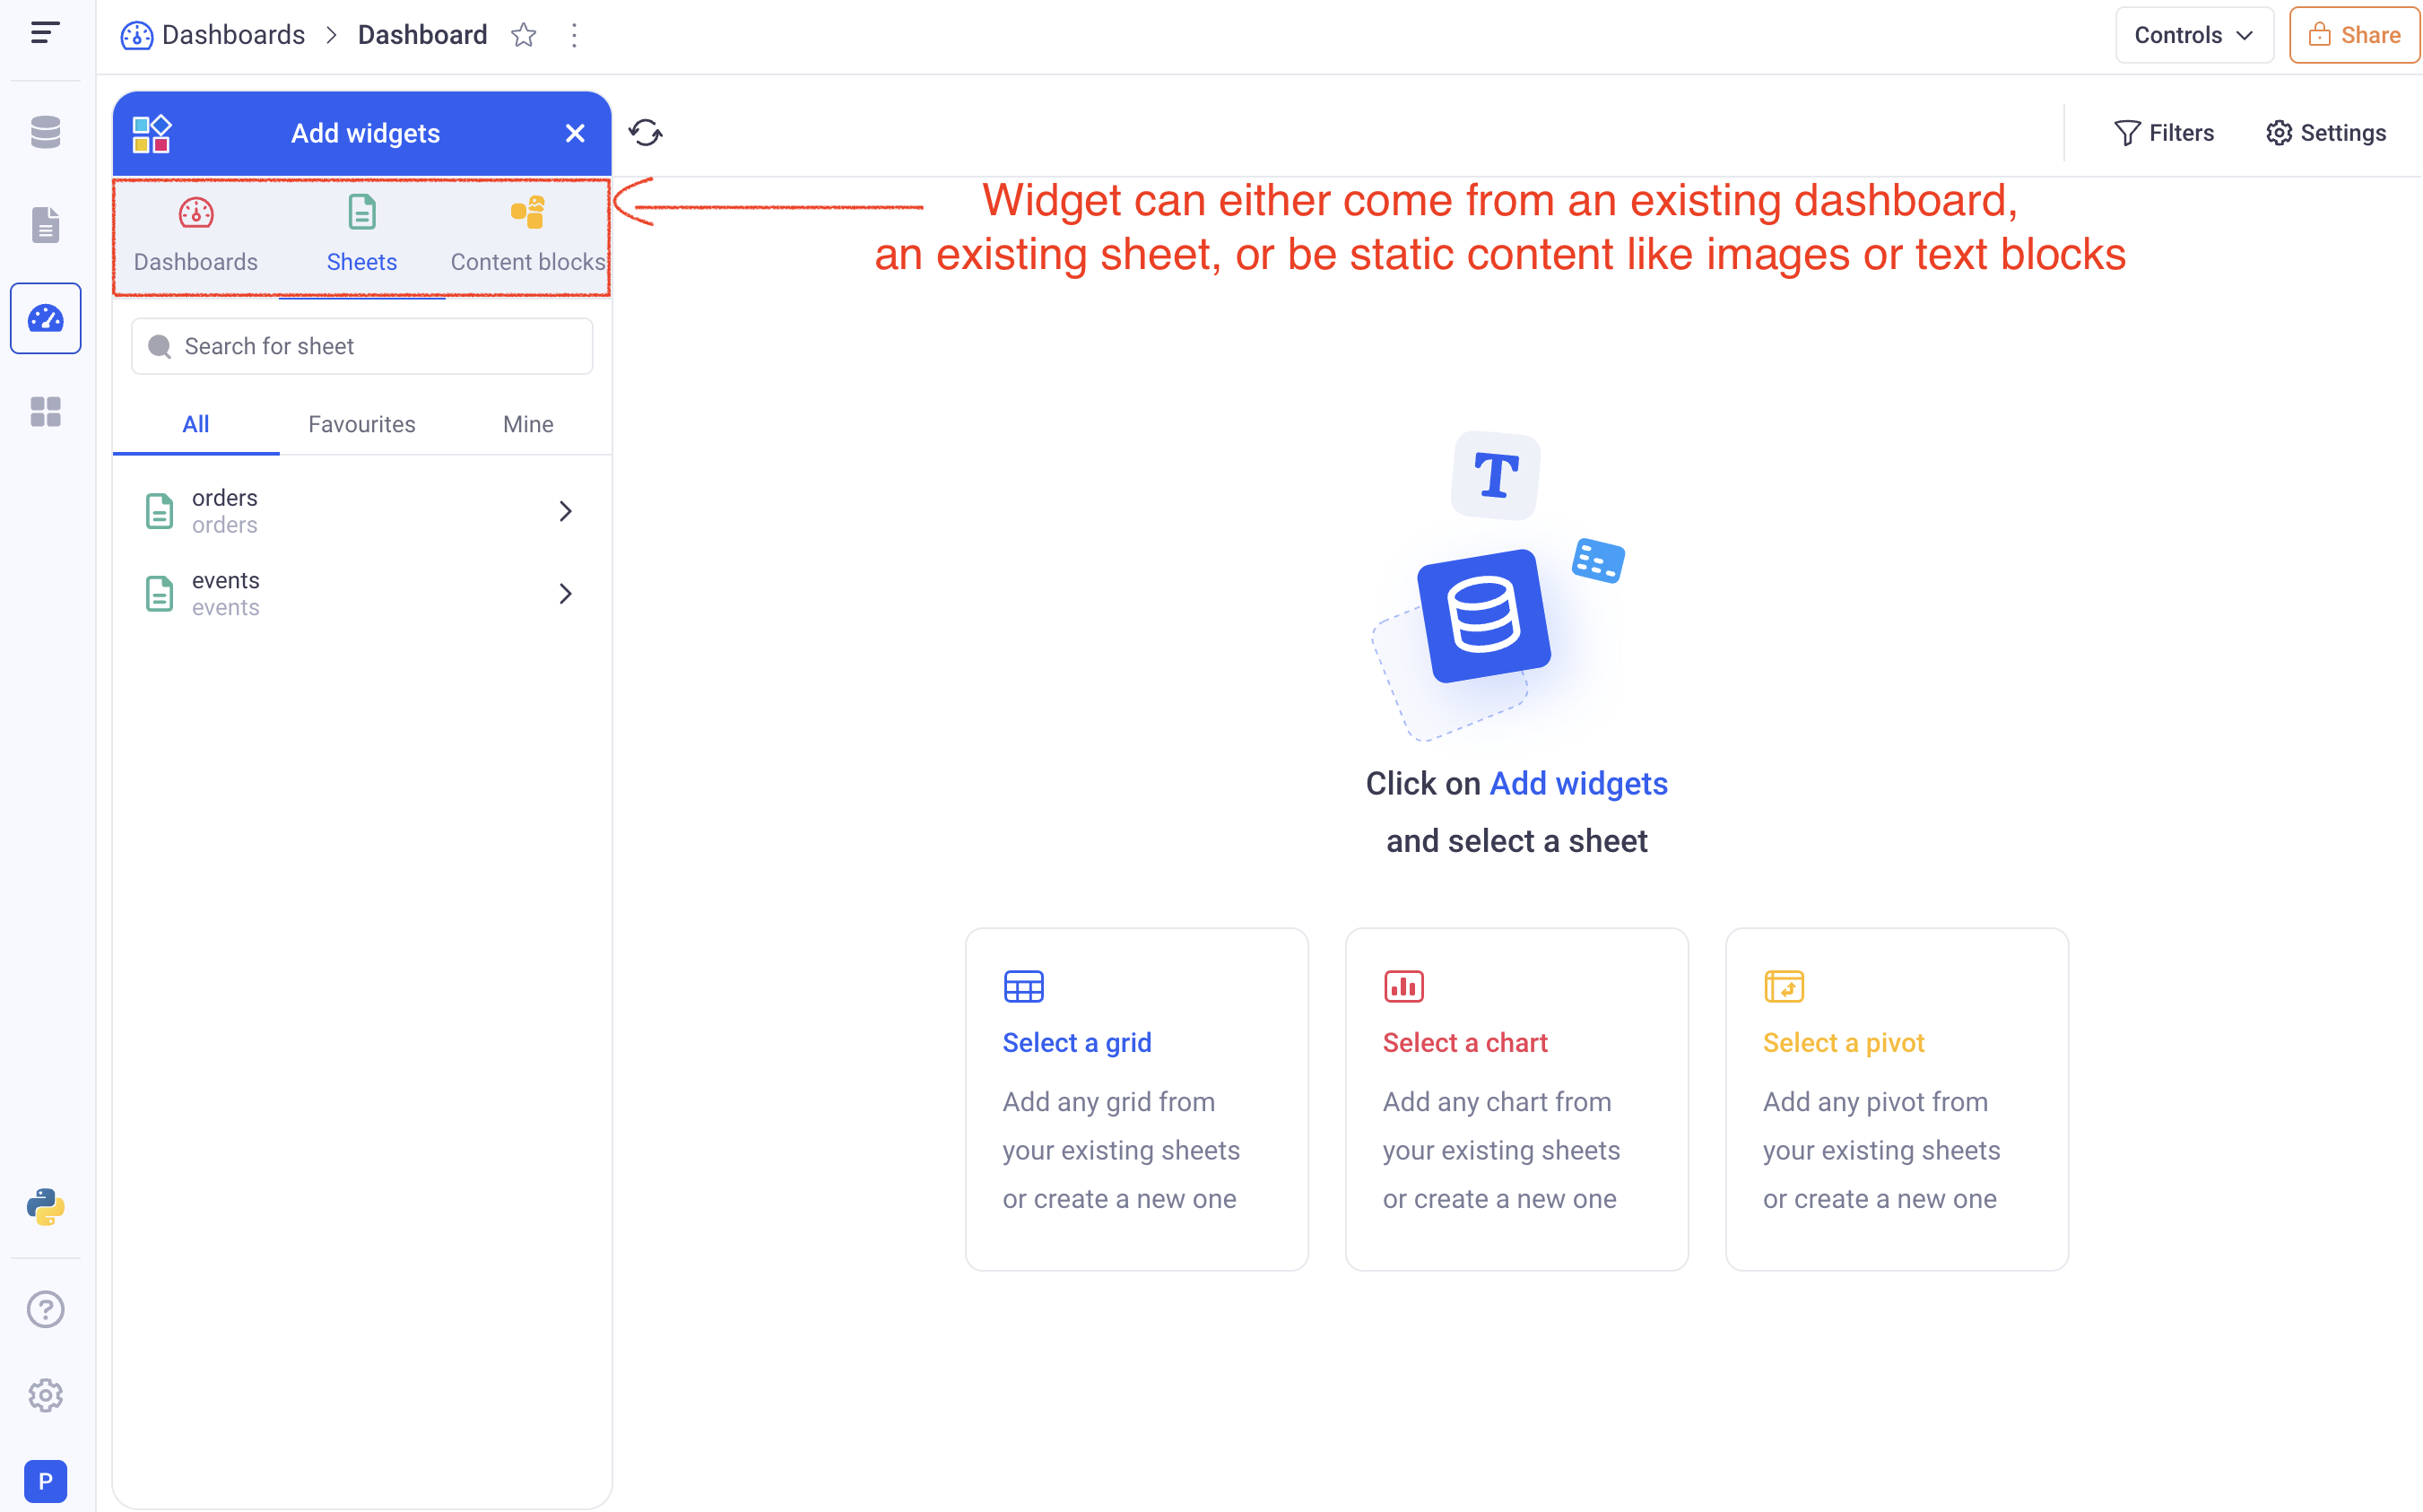
a. Adding widgets from existing sheets
In the widget selector, click on the (Sheets) tab. You will see the list of all the sheets in the workspace. Clicking on a sheet will show all the views contained in that sheet.
From that point, you can either:
- Pick an existing view from that sheet
- Create a new view, that will exist only in the dashboard
ℹ️ All the views that are added to the dashboards will be copies of the ones from the sheet section.
b. Adding widgets from another dashboard
In the dashboards section of the widget selector, you will see all the widgets of each existing dashboard. Simply click on a widget to insert it in the current dashboard.
ℹ️ All widgets will be copied and will not retain any link with the originals.
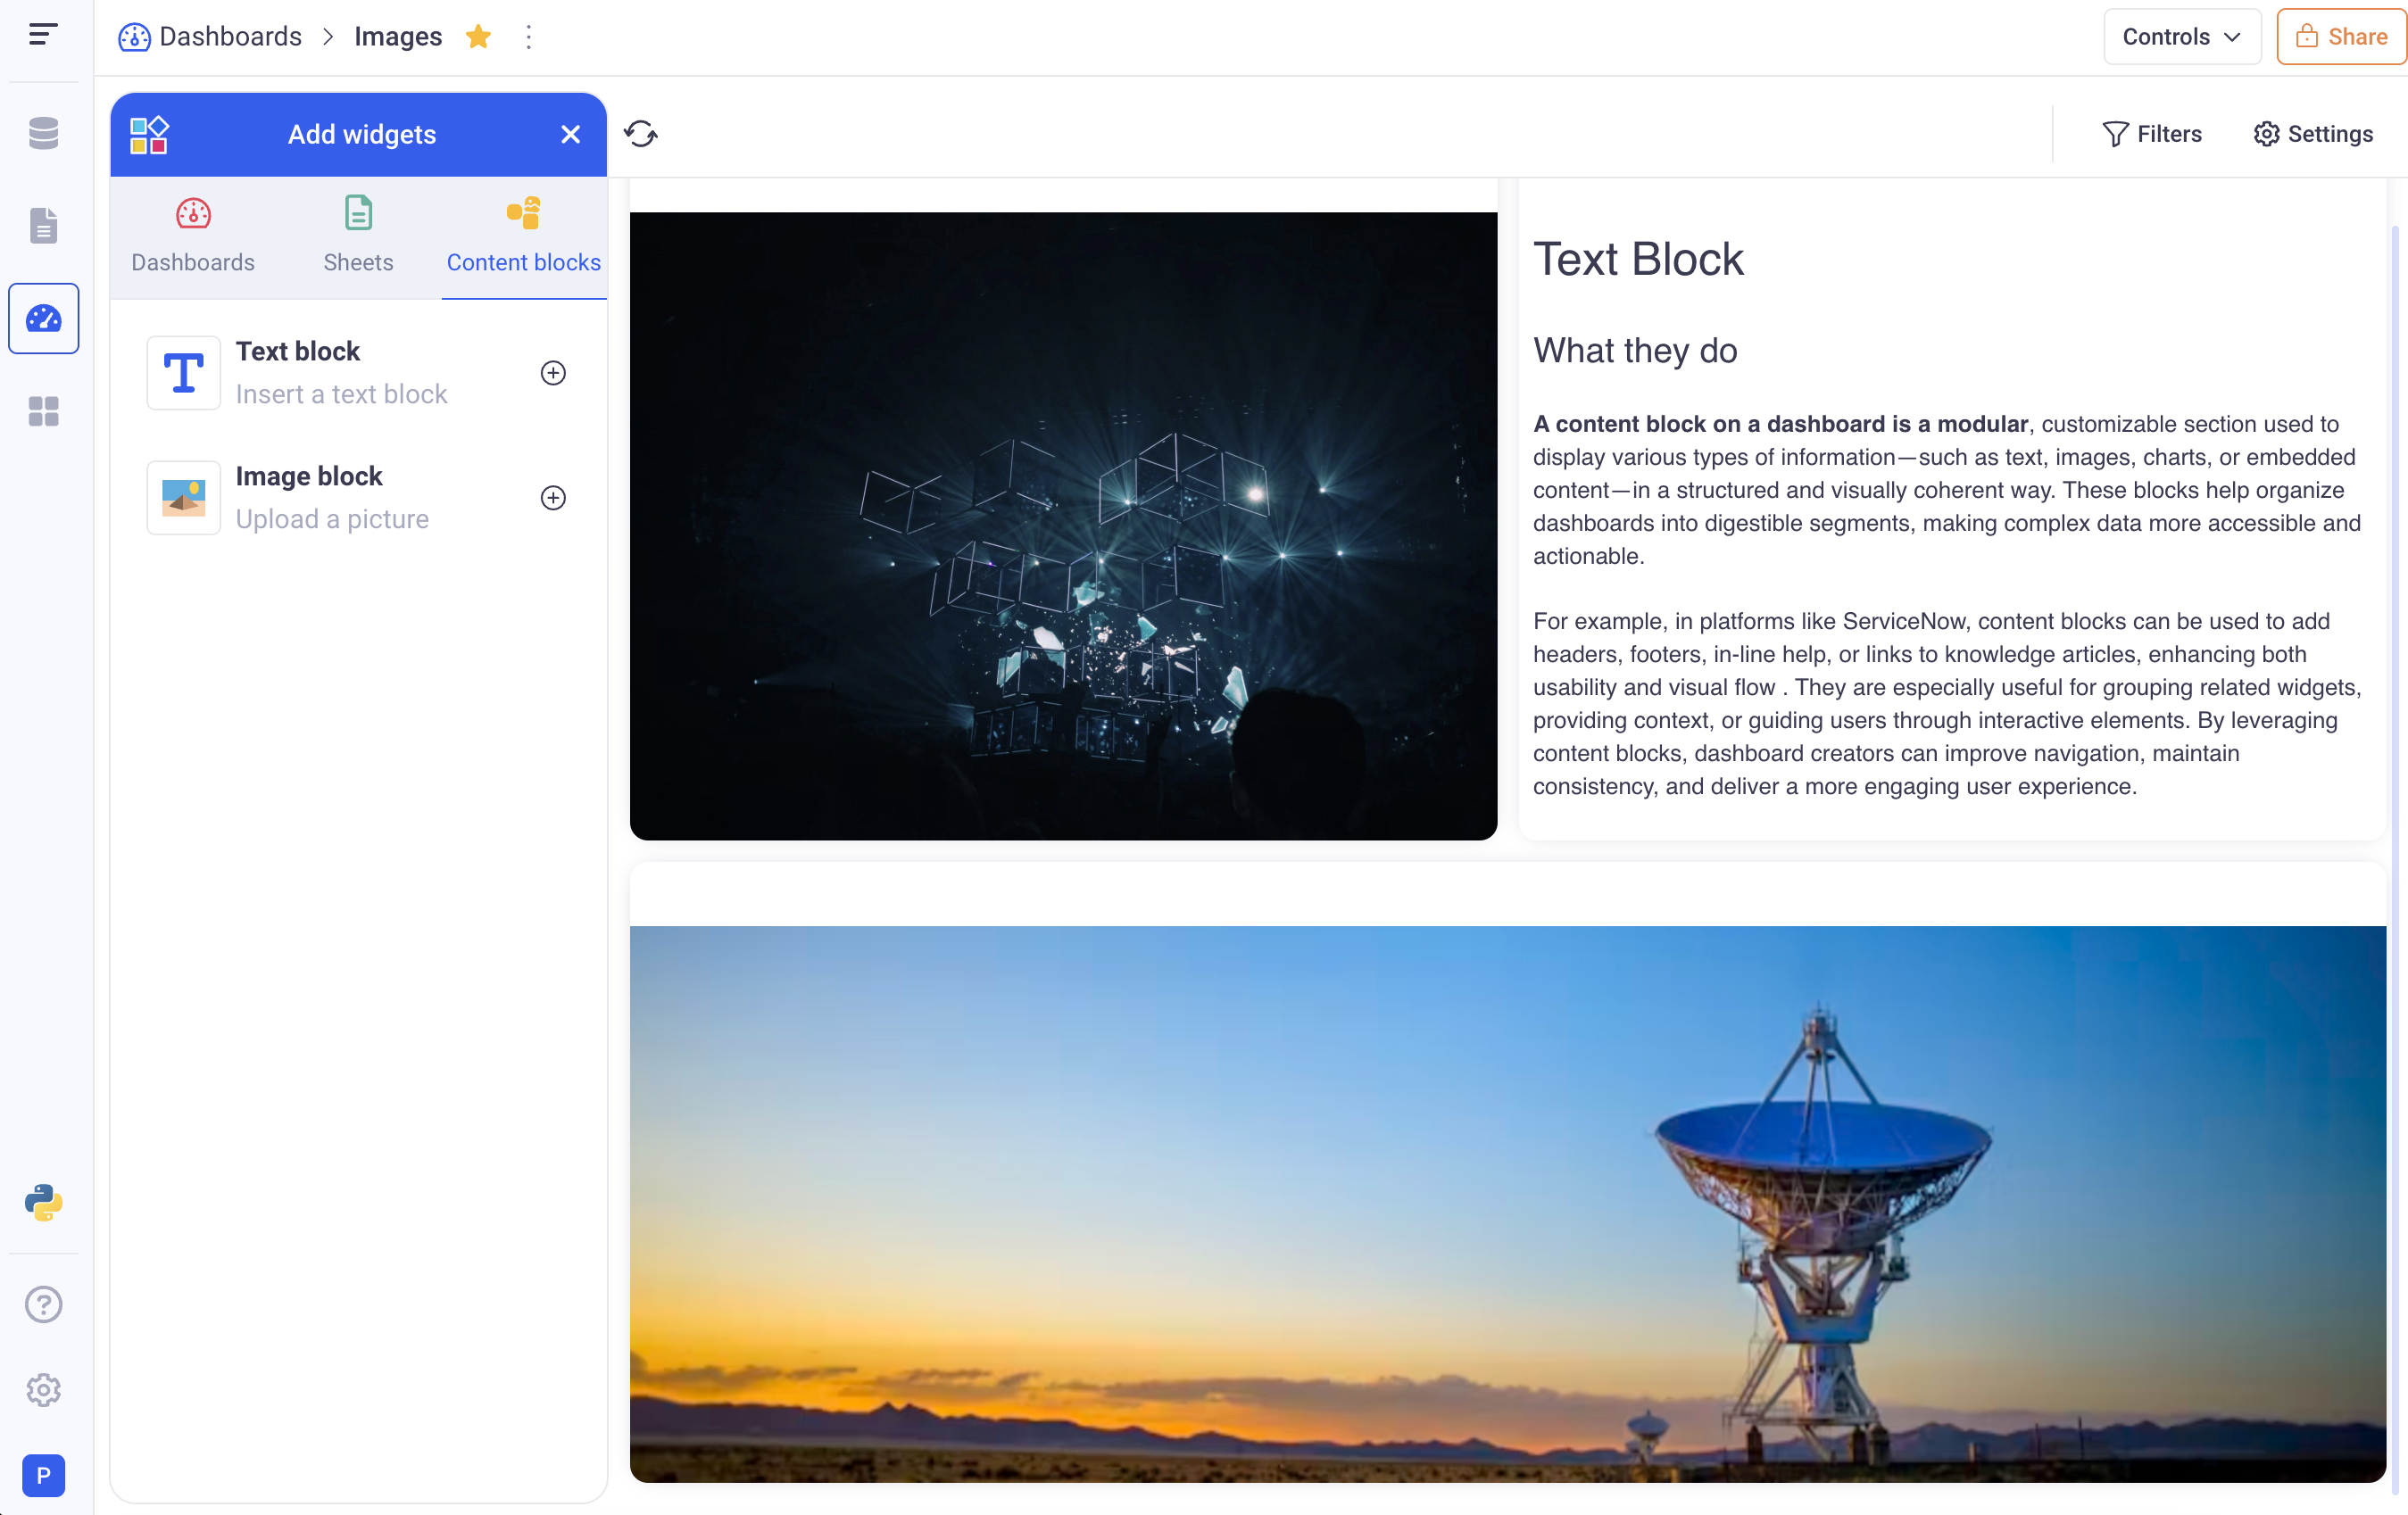
c. Adding content blocks
There are two types of content block:
- A Text block
They provide an easy way to insert static texts to illustrate your dashboards. They support rich text formatting.
- An image block
They let you upload any image into your dashboards.
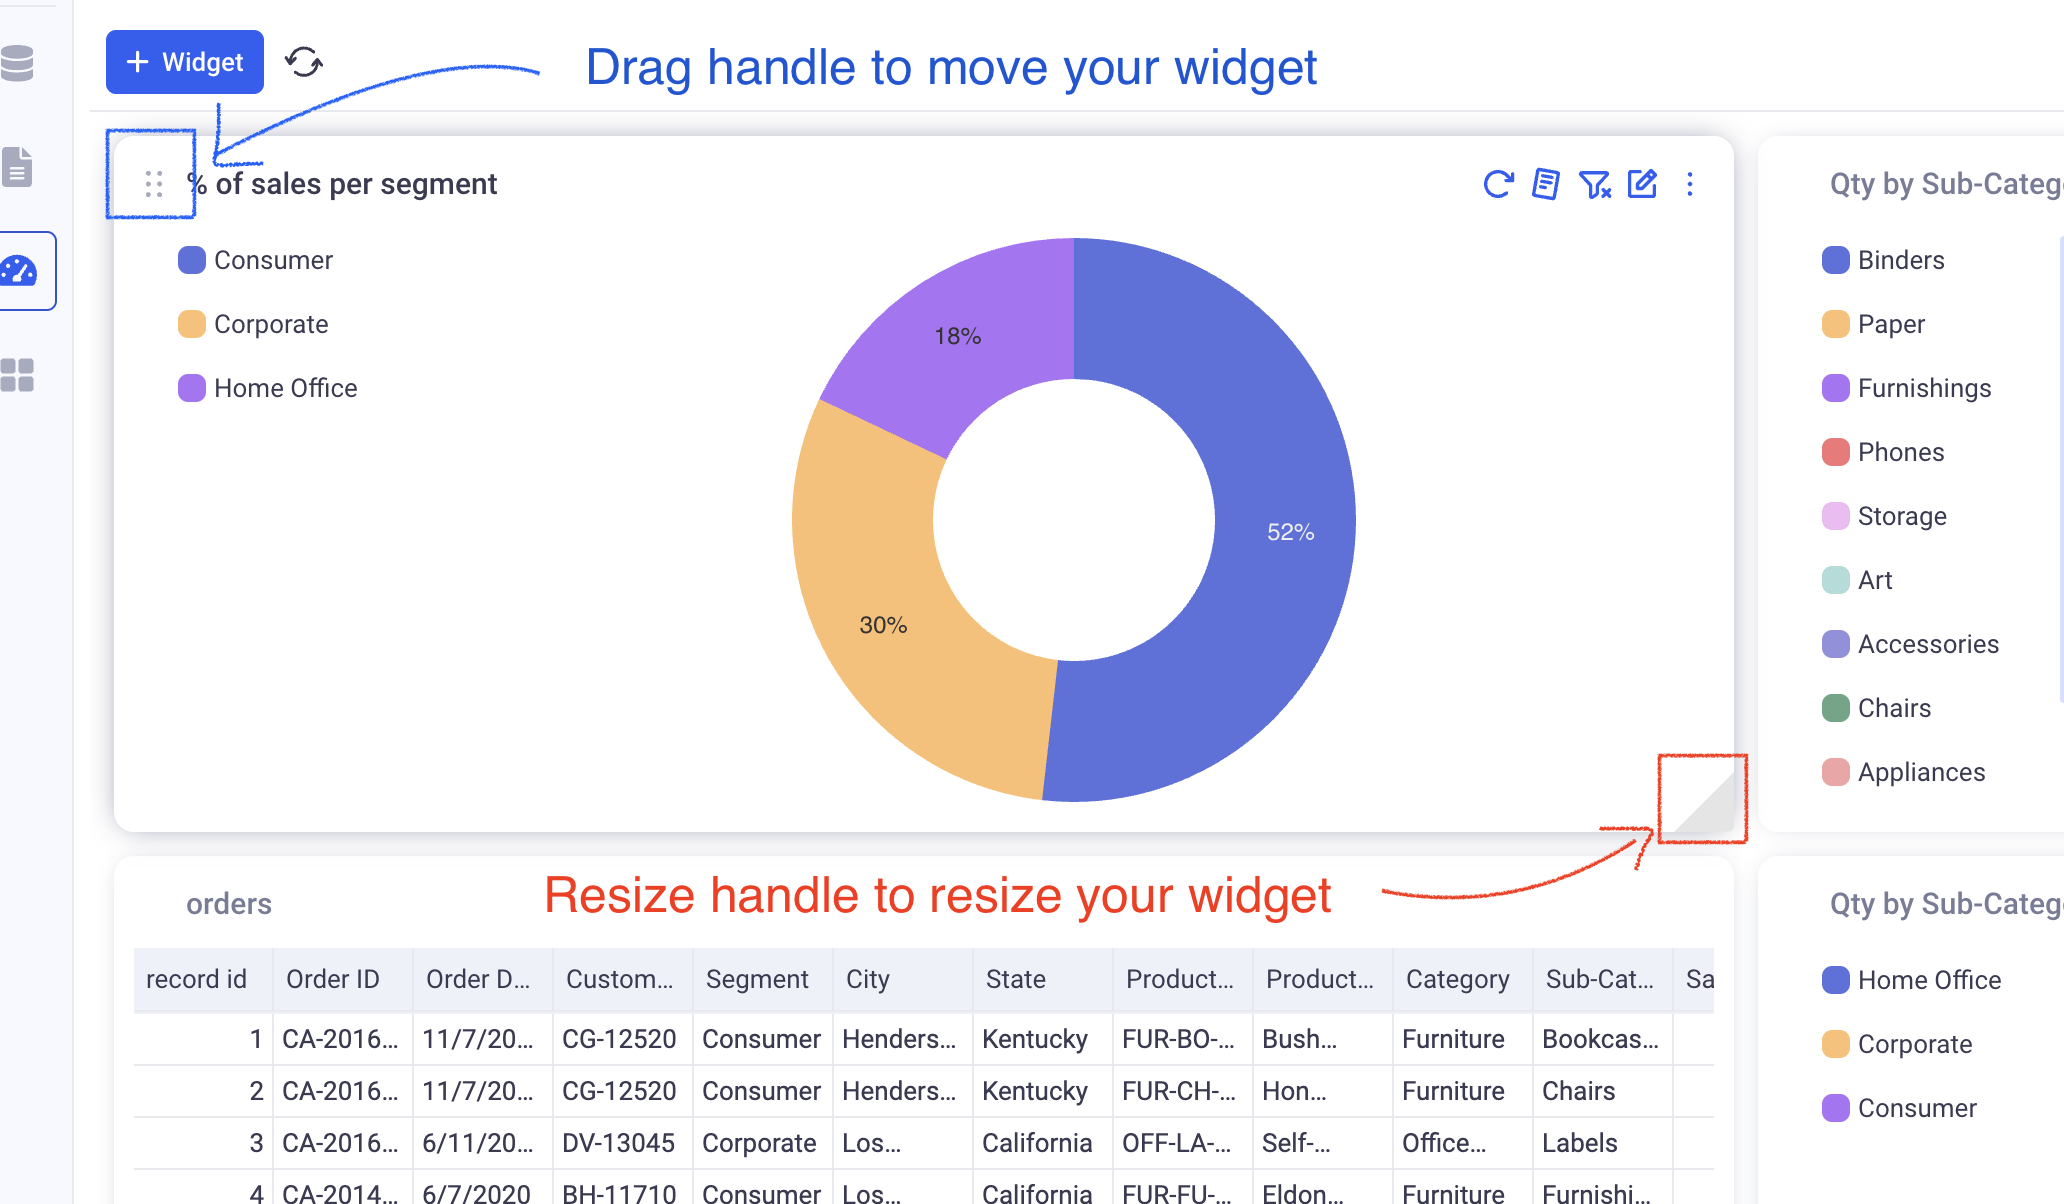
2 Managing your widgets
All your widgets can be resized and moved on the dashboard:
- Move with the the drag handle at the top left of each widget.
- Resize with the resize handle at the bottom right of each widget.
Here are all the actions that you can perform on the widgets. They are available in the menu at the top of each widget (additional options are available in the three dots menu).
-
Refresh: Will recompute a given widget. If one of the underlying datasources changed, the widget will be rendered reflecting that change.
-
Summary: This is available for chart widgets. It will show an automatic summary of the data that is displayed.
-
Ignore filters: Make the selected widget insensitive to the filters applied on the dashboard level (Filters from the control panel as well as filters on the filter menu for the dashboard).
-
Edit widget: This opens the widget in full screen mode and lets you edit its parameters.
-
Rename: This allows to change the name of the widget on the dashboard.
-
Duplicate: This creates a copy of a widget.
-
Delete: This removes the widget from the dashboard. If it was added from a sheet, it will not affect the original view.