Creating a Trading Workflow in KAWA
This scenario shows how to build an automated trading pipeline (Workflow) in KAWA.
The pipeline runs on a schedule and, step by step, does the following: loads and prepares market data, runs a Python script to calculate signals, and sends notifications and a short report.
1. Create a workflow
- Go to Home → Workflows and click + Workflow.
- Enter a name, e.g., Daily — Signals & Report.
Recommendation: create separate workflows for different frequencies (Daily / Intraday) and markets.
2. Trigger
- In the WHEN area, choose At a scheduled time.
- Frequency: Daily
- Time: 06:10 (after market close).
- Time zone: the exchange’s time zone (e.g., America/New_York).
- Only on business days: On.
3. Action steps
3.1 Step 1 — Transform data: prepare market data
3.1.1 Go to Add action
→ Transform data and choose the OHLCV source.
3.1.2 Time
Use a single time column for all records. Ensure the timestamp is UTC ISO-8601 (e.g., 2025-10-17T20:00:00Z).
3.1.3 Order matters
Sort by timestamp (New -> Old) so EMA/RSI are calculated correctly.
3.1.4 Adding simple metrics (Enrich → Formula)
Body ratio — share of the candle body in the day’s range
Name: body_ratio
Formula:
ROUND( ABS(close - open) / ( ABS(high - low) + 1 / POWER(10, 7) ), 4 )
Meaning (0…1):
- 0 ≈ neutral/doji (open ≈ close)
- 1 ≈ strong one-direction day (big body, small wicks)
Range % — relative daily volatility
Name: range_pct
Formula:
ROUND( (high - low) / ( (high + low + close) / 3 + 1 / POWER(10, 7) ), 6 )
Meaning: Higher = a more volatile day. Good for comparing different tickers.
Close position in range — where the close sits within the day’s range
Name: close_pos_in_range
Formula:
ROUND( (close - low) / ( ABS(high - low) + 1 / POWER(10, 7) ), 4 )
Meaning (0…1):
- 0 = closed near low
- 0.5 = around the middle
- 1 = closed near high
3.1.5 Enrich → Lookup column
Goal: pull the exchange and currency for each ticker.
- Source sheet: ref_symbols
- Columns to pull: exchange, currency
Result: the source table gets new columns exchange and currency (e.g., NASDAQ, USD) for each symbol.
3.1.6 Enrich → Manual input
Goal: add simple constants for easier filtering and report/email subjects.
- Add: session
- Value: “EOD”
Why: marks the daily run; used in the AI report and filters.
- Add: market
- Value: “US”
Why: market tag; inserted into email subject and used for grouping.
3.1.7 Data quality checks
- OHLC rules: high ≥ max(open, close), low ≤ min(open, close), high ≥ low.
- Volume: volume ≥ 0; optionally flag volume = 0.
- Uniqueness: no duplicate symbol + timestamp.
- Types: price/volume columns are numeric; no stray text.
3.1.8 Row guardrails (Behavior)
For our scenario set exactly these parameters:
- If no rows are found → Interrupt the workflow.
- If more than [Max num of rows] are found → Interrupt the workflow.
The 1,000 threshold in this field is fixed (not editable).
-
Max num of rows → set a value greater than the current number of rows in the table.
- Example: if the source has ~800 rows, set 1000.
- If you add new tickers/history, increase this value accordingly.
- If Max num of rows ≤ the table size, the workflow will not start.
3.2 Step 2 — Run python script
Goal: Using the data from Step 1 (OHLCV), calculate EMA(10) and EMA(20), and produce a simple BUY/SELL signal for the last bar of each symbol.
3.2.1 Create a Python tool in the library
- Go to Home → Tools → + and create a script named, for example, compute_indicators_and_signals.
- Paste the code and click Save.
import logging
import pandas as pd
from kywy.client.kawa_decorators import kawa_tool

logger = logging.getLogger("script-logger")

@kawa_tool(
    inputs={"symbol": str, "close": float},
    outputs={"ema_fast": float, "ema_slow": float, "signal": str},
)
def main(df: pd.DataFrame, symbol=None, close=None) -> pd.DataFrame:
    try:
        if df is None or df.empty:
            return _empty_result()

        d = df.copy()

        # Ensure required columns (allow simple aliases)
        if "symbol" not in d.columns:
            alt_symbol = next((c for c in ["ticker", "sym"] if c in d.columns), None)
            if alt_symbol:
                d.rename(columns={alt_symbol: "symbol"}, inplace=True)

        if "close" not in d.columns:
            alt_close = next((c for c in ["price", "last", "close_price"] if c in d.columns), None)
            if alt_close:
                d.rename(columns={alt_close: "close"}, inplace=True)

        if ("symbol" not in d.columns) or ("close" not in d.columns):
            logger.warning("Missing required columns; returning empty result")
            return _empty_result()

        # Types & filtering
        d["symbol"] = d["symbol"].astype(str)
        d["close"] = pd.to_numeric(d["close"], errors="coerce")
        d = d[d["close"].notna()]
        if d.empty:
            return _empty_result()

        # Detect/normalize time column
        time_col = next((c for c in ["timestamp", "time", "datetime", "date", "dt"] if c in d.columns), None)
        if time_col is not None:
            if not pd.api.types.is_datetime64_any_dtype(d[time_col]):
                d[time_col] = pd.to_datetime(d[time_col], utc=True, errors="coerce")
            d = d.sort_values(["symbol", time_col])
        else:
            d = d.sort_values(["symbol"])

        # EMA(10) / EMA(20)
        g = d.groupby("symbol", sort=False)
        d["ema_fast"] = g["close"].transform(lambda s: s.ewm(span=10, adjust=False).mean())
        d["ema_slow"] = g["close"].transform(lambda s: s.ewm(span=20, adjust=False).mean())

        # Latest per symbol
        if time_col is not None and d[time_col].notna().any():
            idx_last = g.apply(
                lambda x: x[x[time_col].notna()][time_col].idxmax()
                if x[time_col].notna().any() else x.index.max()
            ).values
        else:
            idx_last = g.apply(lambda x: x.index.max()).values

        out = d.loc[idx_last, ["symbol", "close", "ema_fast", "ema_slow"]].copy()

        if time_col is not None and d[time_col].notna().any():
            out["timestamp"] = d.loc[idx_last, time_col].values
        else:
            out["timestamp"] = pd.Timestamp.utcnow()

        out["signal"] = (out["ema_fast"] > out["ema_slow"]).map({True: "BUY", False: "SELL"})
        out = out[["timestamp", "symbol", "close", "ema_fast", "ema_slow", "signal"]]
        return out.reset_index(drop=True)

    except Exception as e:
        logger.exception("compute_indicators_and_signals failed: %s", e)
        return _empty_result()


def _empty_result() -> pd.DataFrame:
    return pd.DataFrame(columns=["timestamp", "symbol", "close", "ema_fast", "ema_slow", "signal"])
3.2.2 Add an action to the Workflow and link it to Step 1
- In your Workflow, click Add action → Run python script.
- Select python tool from the library → choose compute_indicators_and_signals.
- In Match tool inputs with any of the previous task outputs:
- df → choose 1. Transform data (output of Step 1).
- symbol → the symbol column from Step 1.
- close → the close column from Step 1.
The script is created separately in Tools; the linking to Step 1 data is done here, in the Workflow.
3.2.3 Behavior (guardrails) for Step 2
- If no rows are found → Interrupt workflow.
- If more than 1000 rows are found → Interrupt workflow.
- Max num of rows → set a value higher than the current table size (with a 10–20% buffer).
- Example: table ≈ 800 rows → set 1000 or more.
- If you add history/new tickers, increase this value.
3.3 Step 3 — AI prompt
Goal: generate a short EOD (end-of-day) report in Markdown using the results from Step 2 — Run python script (one last bar per symbol).
3.3.1 Add an action
Click Add action → AI prompt.
3.3.2 Paste the prompt text
Copy this text into the Prompt field:
You are a pragmatic trading assistant. Produce a concise end-of-day (EOD) report in **Markdown**.
## Data
Use the table inserted below. Each row is the latest bar per symbol with columns:
timestamp, symbol, close, ema_fast, ema_slow, signal.
If the table is empty, output exactly: `No fresh data for this session.`
## Calculations
- Compute **ema_spread_pct = (ema_fast - ema_slow) / close * 100**.
- Count symbols by signal (BUY / SELL). Any other value → treat as **HOLD**.
- Formatting: prices → 2 decimals; percentages → 2 decimals with `%`. Neutral tone; no advice.
## Output (Markdown)
### EOD Summary
- BUY: <count>, SELL: <count>, HOLD: <count>.
- Notables: mention any symbols with **|ema_spread_pct| ≥ 1.00%**.
### Highlights
**Top BUY** (up to 3 by highest positive ema_spread_pct):
List as `TICKER — close $X.XX (spread Y.YY%)`.
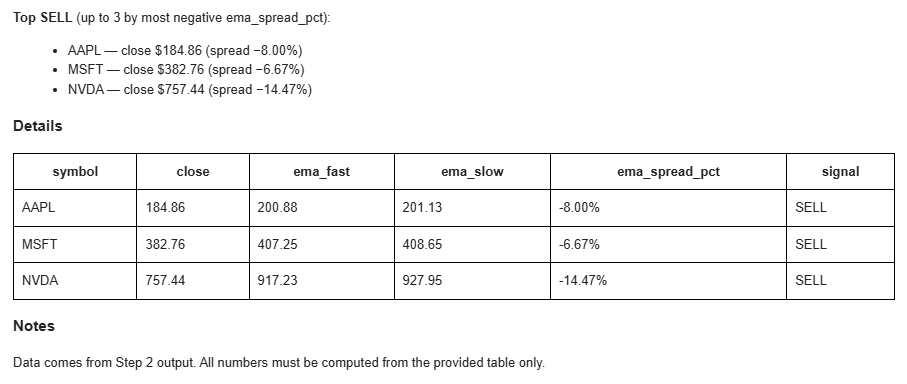
**Top SELL** (up to 3 by most negative ema_spread_pct):
List as `TICKER — close $X.XX (spread −Y.YY%)`.
### Details
Provide a compact table sorted by `symbol` with columns:
`symbol | close | ema_fast | ema_slow | ema_spread_pct | signal`.
### Notes
Data comes from Step 2 output. All numbers must be computed from the provided table only.
3.3.3 Connect data from Step 2 (Grid)
- Place your cursor under the ## Data section.
- Click the + button on the right of the toolbar → Use data from: 2. Run python script → Grid.
3.4 Step 4 — Send email
Goal: send the EOD report generated in the previous step (AI prompt), with basic run context.
3.4.1 Add an action
Add action → Send email.
3.4.2 Fill in the fields
- Recipients — specify recipients (comma-separated).
- Subject — Daily — Signals & Report.
3.4.3 Build the Body
Insert the base text:
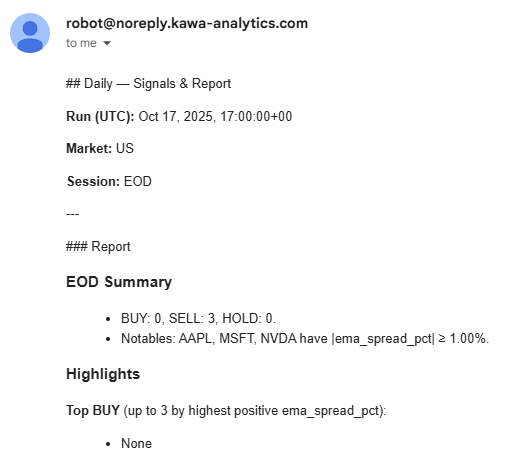
## Daily — Signals & Report

Run (UTC):
Market:
Session:

---

### Report
Now add dynamic “chips” (click the + button on the right side of the toolbar):
-
For the lines Run (UTC) / Market / Session:
- Transform data → Aggregated values → timestamp
- Transform data → Aggregated values → market
- Transform data → Aggregated values → session
-
Under the Report heading:
- AI prompt → Choose data → Generated Content (this is the Markdown text generated by Step 3).
4. Finish
- Click Create workflow.
- In Run history, make sure the flow reaches the Send email step with Success status.
5. Result — receiving the email
After the Workflow runs successfully, the report arrives by email.
6. Conclusion
We built a fully automated EOD pipeline in KAWA:
- Transform data prepares OHLCV and adds helper fields.
- Run python script calculates EMAs and signals.
- AI prompt creates a short Markdown report.
- Send email delivers the final result.
Following the guardrails (especially Max num of rows) and inserting only the needed fields in Steps 3–4 ensures reliable email delivery and no failures—even on “empty” days.